
Retail Management

Branch Excel files are merged on Monday morning for the weekly sales report

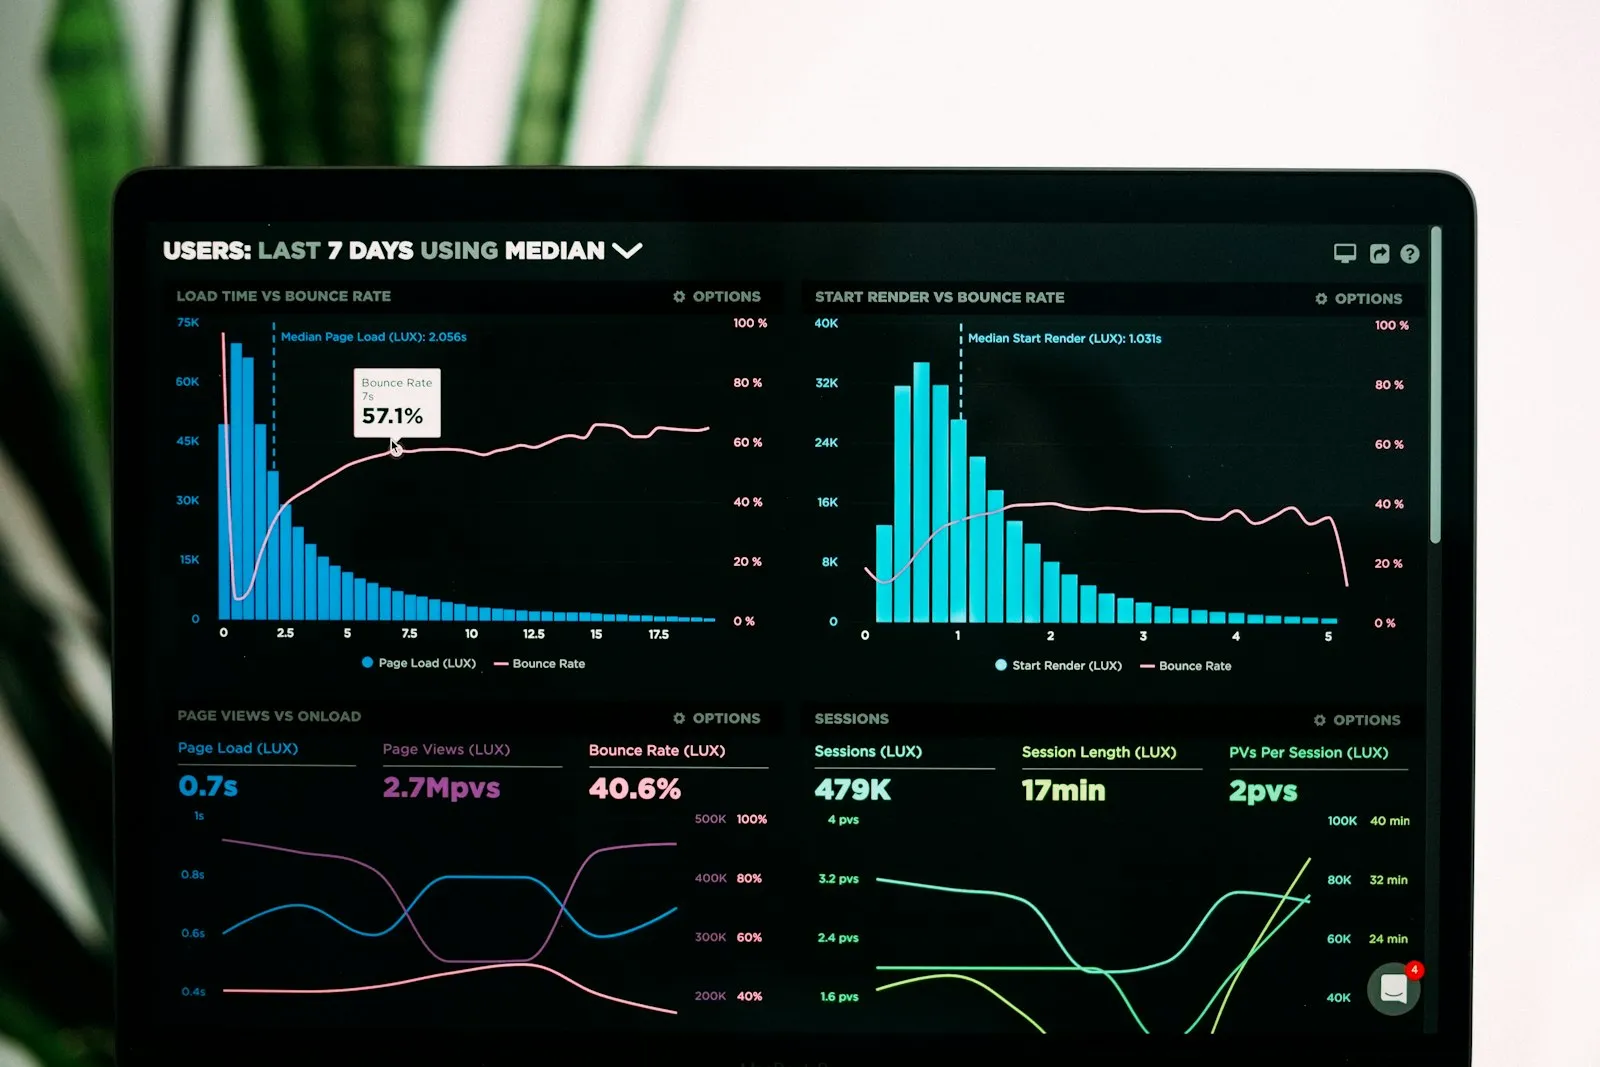
Business Intelligence and Reporting shows sales, stock, customer and finance data on a per-person dashboard. A notification arrives when a threshold is crossed; stock and campaign suggestions come from past sales, and the store manager makes the decision.

Business intelligence and reporting
In short

Business Intelligence and Reporting is the Panda Store module that shows sales, stock, customer and finance data instantly on dashboards arranged by user role, and sends a notification when a defined threshold is crossed. Suggestions for the stock plan, campaign timing and budget are produced from past sales, season and trend data; ABC and RFM analysis classify products and customers, and basket analysis shows products sold together. Store management interprets and decides.

How is this work done today?

  • The weekly report is merged on Monday morning

    Each branch's sales Excel comes to head office, and someone checks the formulas and gathers them into one table; the meeting starts once the report is finished.

    1 person × 3 hours / week
  • Nobody is told when stock falls to a critical level

    Which product has run out is found on the shelf round or when a customer asks; a branch below target is seen in the month-end report.

    1 store manager × 30 minutes / day
  • Which product is profitable is a guess

    Revenue is known, but profit by product, returns and campaign cost are in separate files; the season order decision is made with last season's remembered figures.

    2 people × 1 day / season

How does Business intelligence and reporting work?

  1. 1

    Indicators and thresholds are defined

    The sales manager adds revenue and basket indicators, the finance manager collection and cash indicators, and the general manager all indicators to their own dashboard; threshold values are set by role.

  2. 2

    Data updates instantly

    A till sale raises revenue, reduces stock and recalculates profit; the dashboard shows store, marketplace and field sales at the same time, and no Excel export is needed.

  3. 3

    Threshold breaches are notified

    When stock falls to a critical level, sales fall below target or complaints rise, a notification goes to the person concerned; who saw it and when stays in the record.

  4. 4

    Analysis and suggestion, decision by a person

    ABC and RFM classification, basket analysis and forecast suggestions based on past sales are ready every morning; store management makes the stock, campaign and budget decisions.

See how Business intelligence and reporting would work in your business

Tell us briefly about your process and we will walk through the screens with your own example.

  • Reply the same business day
  • 15+ years of experience
  • 90 client businesses

Business intelligence and reporting features

Business intelligence and reporting: Per-person dashboard
  • Per-person dashboard

    Each user builds a dashboard by role; sales, finance and general managers see different indicators on one screen, on mobile and in the browser.

  • Live data

    Sales, stock and profitability update with every till movement; store, marketplace and field sales on the same dashboard, with a freely chosen date range.

  • Threshold alert system

    Threshold definitions for critical stock level, below-target sales and rising complaints; notifications go out by email, SMS or the mobile app.
Business intelligence and reporting: Forecast suggestion
  • Forecast suggestion

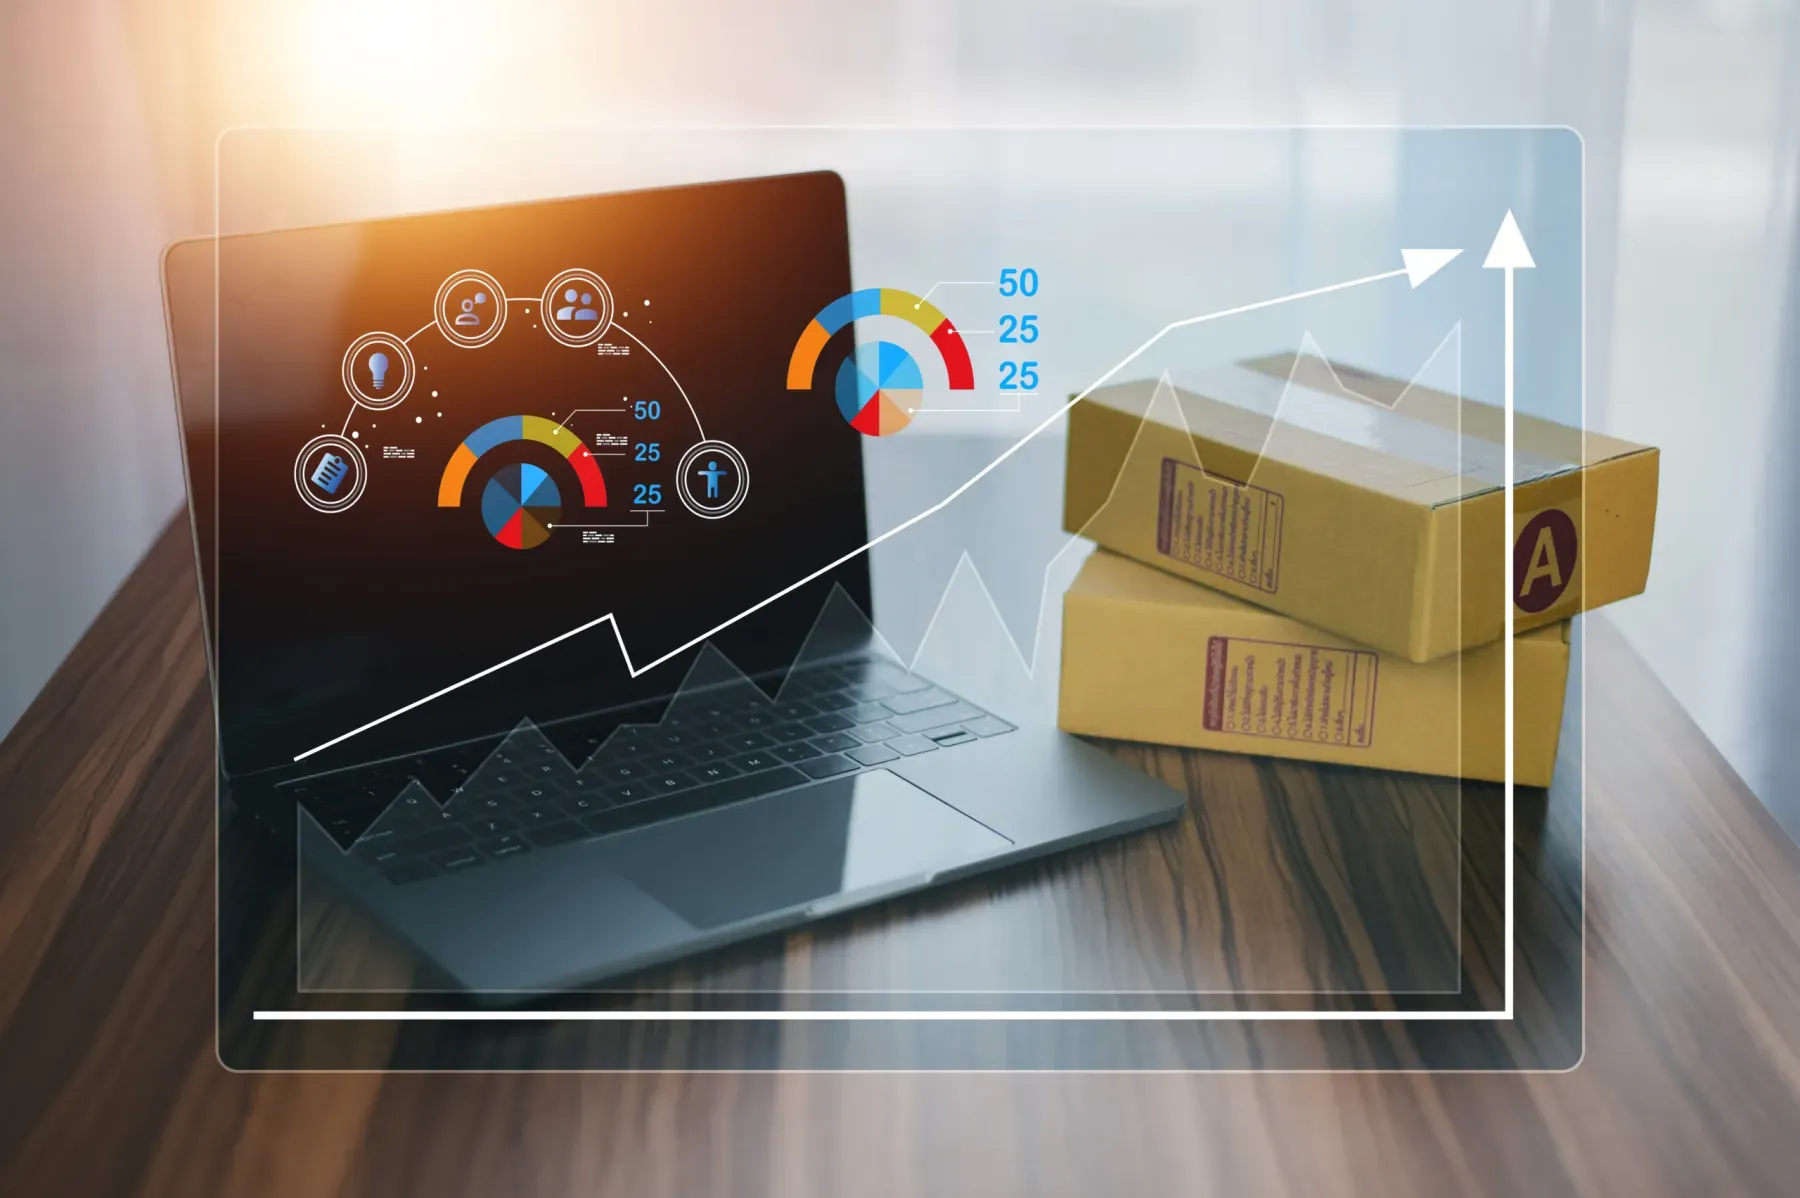
    Suggestions for the stock plan, campaign timing and budget from past sales, season and trend data; the store manager interprets the figure and makes the decision.

  • ABC and RFM analysis

    A-B-C class by product and customer value; with RFM, customer groups by last purchase, frequency and amount move to the campaign list.

  • Basket and affinity analysis

    Shows which products are sold together; a product pair list for cross-selling suggestions and shelf placement decisions is exported to Excel.

  • Branch and channel comparison

    Revenue, profit and returns by branch, channel and salesperson; target-versus-actual and period comparison appear on the same chart.

  • Ready report library

    Day-end, weekly sales, stock ageing, receivables ageing and campaign reports are ready; a scheduled report goes out as a PDF by email.

What does Panda AI add to Business intelligence and reporting?

The Executive Briefing Agent is the Panda AI agent that turns sales, collections, stock and production data into a single-message summary every morning.

  1. Today Departments are asked for Excel files for the weekly report With the agent A single-message summary lands on WhatsApp every morning
  2. Today Figures arrive from different systems at different times With the agent Sales, collections, stock and production in one table
  3. Today A critical delay is only noticed in the meeting With the agent The agent alerts you itself when a threshold is crossed

Jobs it takes on

  • Daily and weekly management summary
  • Target versus actual comparison
  • Cash, stock and delay threshold alerts
  • Pre-meeting briefing pack
  • Spotting inconsistencies between departments
  • Instant questions and answers

The agent prepares, a person approves. Anything that posts a record or sends something outside the company goes through your approval.

Explore Panda AI agents

Frequently asked questions about Business intelligence and reporting

Which store types is it suitable for?

In apparel, sales and remaining stock by season and size-colour; in supermarkets and grocery, waste, expiry and basket analysis; in electronics, profitability by product group and the service record; for wholesalers and distributors, revenue and collection by dealer and region. The indicator set is prepared for each type at setup.

How does the forecast suggestion work, and how reliable is it?

A next-period sales suggestion by product and branch is produced from past sales, seasonality and trend data; the stock plan, campaign timing and budget draft are prepared according to it. The suggestion rests on past data and cannot know a new store or a new product. The store manager interprets the figure and makes the order and campaign decision.

Who receives a threshold breach notification, and how?

A responsible person and channel are defined for each threshold: critical stock level goes to purchasing by mobile notification, below-target sales to the branch and regional manager by email, and rising complaints to customer relations. Who saw the notification and when stays in the audit log; the same threshold is notified once a day, and the repeat frequency is adjustable.

What are ABC and RFM analysis for?

ABC divides products and customers into A, B and C classes by revenue or profit contribution; class A products are never left out of stock, and shelf space is questioned for class C. RFM groups customers by last purchase date, frequency and amount; the list of valuable customers who have not visited for a long time moves to the CRM module for a campaign.

How does basket analysis affect the store layout?

Pairs and triples of products sold together are extracted from till receipts; the list is taken by product, branch and period. Decisions on shelf placement, product selection at the checkout and campaign bundles are made with this list. The analysis is a suggestion; the visual merchandising lead and the store manager make the arrangement. The result moves to a bundle definition in the campaign module.

Can reports be taken as Excel and PDF?

Yes. Every dashboard and report is exported as Excel and PDF for any date range; a scheduled report goes out by email every morning or on a set day of the week. A limited-access user can be opened for your accountant and the board; a person sees only the branch and indicators they are authorised for.

Can we move our existing Excel reports to the dashboard?

At setup, which Excel report is prepared by whom and how often is listed; a dashboard indicator or ready report is defined for each. The formula logic is written on the system side, and the source data comes from till and stock records. After the switch, Excel is used only for export; the person who prepared the report becomes the person who interprets it.

What does the agent do in business intelligence?

Sales, stock and customer indicators are updated every morning; an out-of-threshold value is passed to the person concerned, and the branch morning report is ready at 07:00. Exporting to Excel and merging ends; a person interprets, and the store manager makes the stock and campaign decisions. Store management sets the threshold definitions and the recipient list. Scenario: morning report.

See Business intelligence and reporting with your own data

Describe your process in a few sentences and we will show you the modules that fit.

  • 15+ years of enterprise software experience
  • In the cloud or on your own server
  • Processes compliant with KVKK (Turkey's data protection law)

Last reviewed: · Panda Yazılım product team