

Panda CRM

The sales dashboard is prepared on Monday morning; by Friday evening the numbers have changed

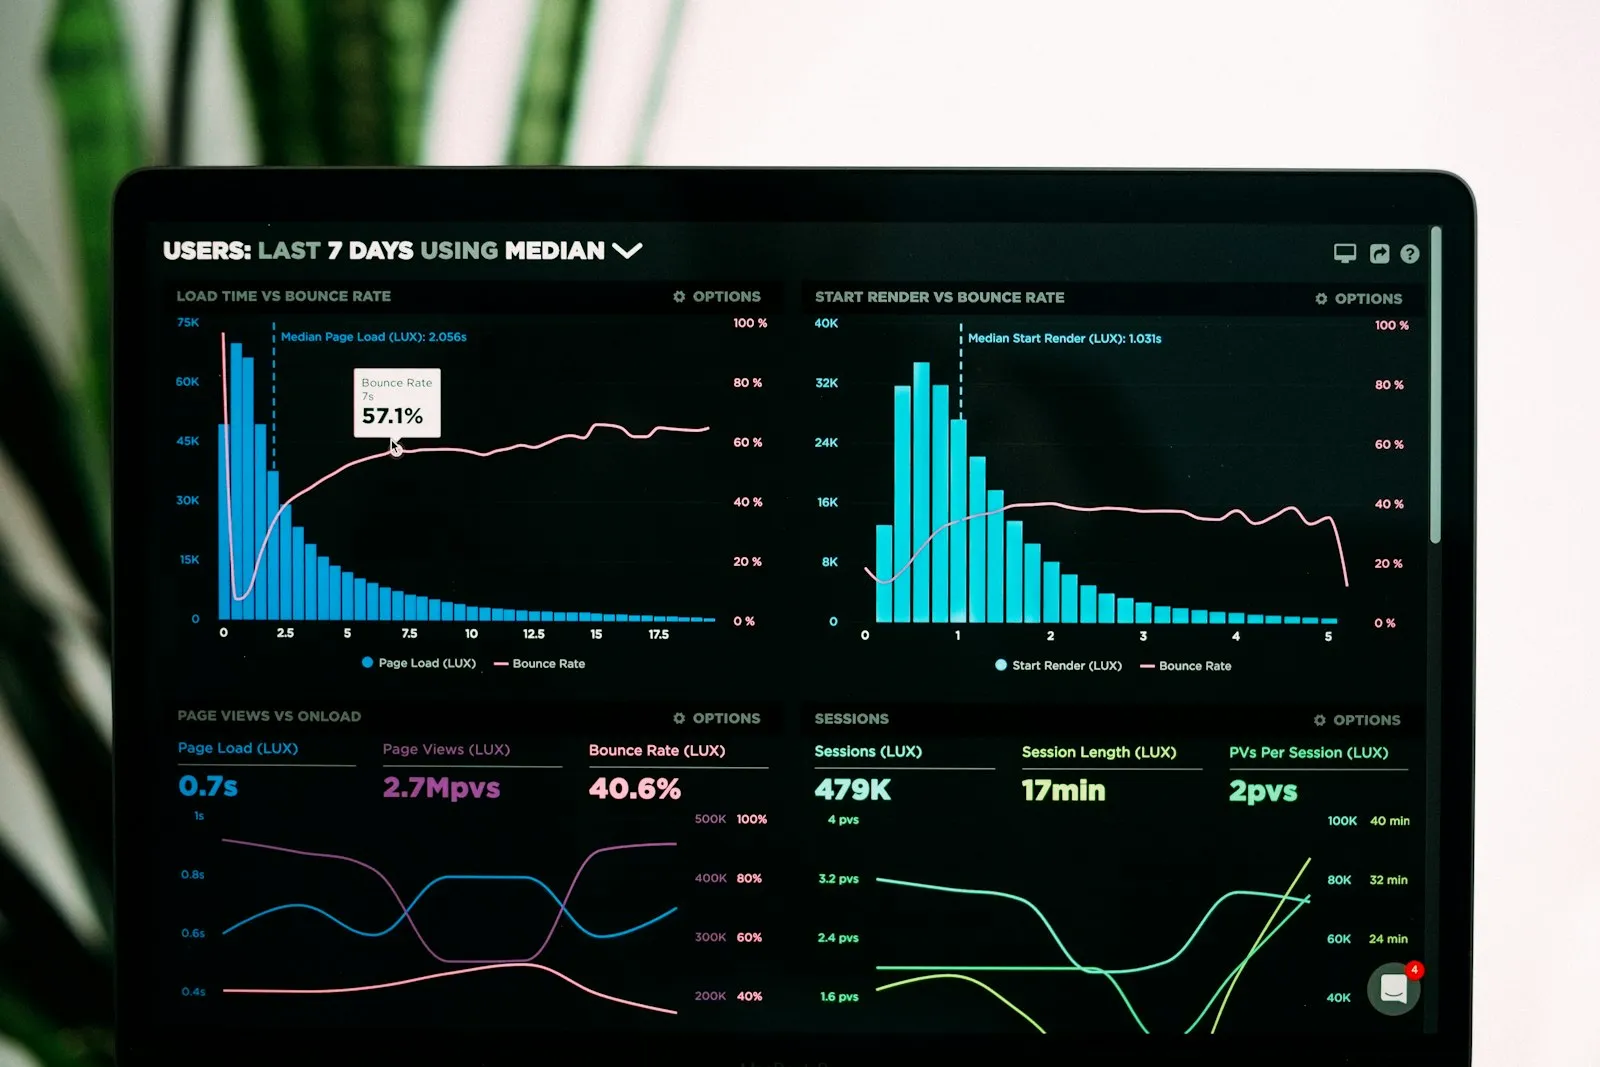
The Dashboard and Report Management module shows sales, collection, customer and support indicators live on role-based dashboards. Each department designs its own report; a value outside its threshold goes to the person concerned.

Dashboard and reports
In short

Dashboard and Report Management is the Panda ERP CRM module that shows sales, collection, customer satisfaction and support data live on dashboards specific to department and user role. Each user sees only what they are authorized for; the sales representative follows target achievement and the manager follows team comparison. Report design is done by drag and drop, and a value outside its threshold turns into a notification.

How is this work done today?

  • The dashboard is built in Excel once a week

    Sales, collection and open ticket figures are taken from three screens and poured into an Excel chart; by the time the presentation ends the data is stale.

    1 analyst × 4 hours / week
  • Everyone sees the same report

    The representative sees the whole team's figures and accounting sees the sales target; what is shown to whom cannot be set, and the report circulates by email.

    1 manager × 1 hour / week
  • A deviation is noticed in the meeting

    The collection rate dropped and support tickets rose; nobody sees it that day, and it is discussed at the monthly meeting.

    2 managers × 2 hours / month

How does Dashboard and reports work?

  1. 1

    Indicators are selected

    Indicators such as sales volume, pipeline, target achievement, collection rate, open tickets and SLA compliance are picked from a list built on CRM and ERP data.

  2. 2

    The dashboard is designed by role

    Separate dashboards for sales, marketing, support and management; charts and tables are placed by drag and drop. The user sees only the data they are authorized for.

  3. 3

    Data flows live

    The dashboard pulls current data at every opening; the morning summary goes out as an email and mobile notification. A value outside its threshold goes to the person concerned.

  4. 4

    The report is shared

    Dashboards and reports are exported as PDF and Excel, with period comparison in one click; the forecast indicator shows the sales and customer trend, and interpretation stays with people.

See how Dashboard and reports would work in your business

Tell us briefly about your process and we will walk through the screens with your own example.

  • Reply the same business day
  • 15+ years of experience
  • 90 client businesses

Dashboard and reports features

Dashboard and reports: Role-based dashboard
  • Role-based dashboard

    Separate dashboard templates for the sales representative, sales manager, marketing, support and general manager; each user edits their own dashboard.

  • Report designer

    Chart, table and indicator card by drag and drop; filter, date range and breakdown are changed by the user.

  • Live indicators

    Sales volume, pipeline amount, collection rate, customer satisfaction and open ticket count are current at every opening.


Dashboard and reports: Team and target tracking
  • Team and target tracking

    Target achievement, closing rate and activity count by representative side by side; period comparison in one click.

  • Threshold and notification

    Lower and upper thresholds are set on an indicator; a value outside the threshold goes to the person concerned by email and mobile notification.

  • Permissioned view

    View permission per user by dashboard, report and field; region and team filters work according to permission.

  • Forecast indicator

    A period forecast from the pipeline and past sales, with customer trend and churn risk flags; an AI-assisted suggestion, and the decision is yours.

  • Export and scheduled sending

    Dashboards and reports as PDF and Excel; the weekly report goes to defined people by scheduled email, with the same dashboard in the mobile app.

What does Panda AI add to Dashboard and reports?

The Executive Briefing Agent is the Panda AI agent that turns sales, collections, stock and production data into a single-message summary every morning.

  1. Today Departments are asked for Excel files for the weekly report With the agent A single-message summary lands on WhatsApp every morning
  2. Today Figures arrive from different systems at different times With the agent Sales, collections, stock and production in one table
  3. Today A critical delay is only noticed in the meeting With the agent The agent alerts you itself when a threshold is crossed

Jobs it takes on

  • Daily and weekly management summary
  • Target versus actual comparison
  • Cash, stock and delay threshold alerts
  • Pre-meeting briefing pack
  • Spotting inconsistencies between departments
  • Instant questions and answers

The agent prepares, a person approves. Anything that posts a record or sends something outside the company goes through your approval.

Explore Panda AI agents

Frequently asked questions about Dashboard and reports

What is the difference between Dashboard and Report Management and Business Intelligence Solutions?

This module is the role-based dashboard of CRM and sales data: the daily screen for representatives, managers and the support team. Business Intelligence Solutions is the analysis layer that combines finance, production, stock and sales by group company and branch. Both use the same database; one is operations, the other is management analysis.

Can we design the dashboard ourselves?

Yes. You start with a ready template; charts, tables and indicator cards are added by drag and drop and filters and breakdowns are changed. No technical knowledge is needed for the design. Department templates are edited by the manager and personal dashboards by the user; template changes are kept in the audit log.

How current is the data?

The dashboard pulls CRM and ERP data live at every opening; there is no separate data warehouse or overnight transfer. The morning summary goes out at the time you define as an email and mobile notification. For heavy reports a cache period can be defined; the period is shown on screen.

Who sees which data?

Permission is defined by dashboard, report, field and record. The representative sees their own customers and target, the sales manager sees their team and the general manager sees everything. Accounting does not see the sales target and sales does not see collection detail; the rule is your definition. Export is also bound to permission.

How does the threshold alert work?

A lower and upper threshold is written on an indicator: when the collection rate falls below the value you set or the open ticket count rises above it, a notification goes to the person concerned. The notification is by email and mobile; who gets it is defined per indicator. The alert history appears in the report.

What is the forecast indicator based on?

A period forecast is calculated from the opportunity amount in the pipeline, stage probability and past period sales; the customer trend is derived from order frequency and last contact date. The AI-assisted suggestion supports decisions; the manager decides on target revision and action.

How do reports go to the board or the customer?

Dashboards and reports are exported as PDF and Excel; a weekly or monthly report goes to defined people by scheduled email. Period comparison and a comment field are part of the report. The same dashboard can be followed on the phone in the mobile app; permissions apply there too.

What does the agent do in dashboards and reports?

Sales, collection and support indicators are updated at 07:00, a value outside its threshold is passed to the person concerned, and a short written summary lands at the top of the dashboard. Nobody merges the report in Excel; interpretation and decisions stay with people. Scenario: report automation.

See Dashboard and reports with your own data

Describe your process in a few sentences and we will show you the modules that fit.

  • 15+ years of enterprise software experience
  • In the cloud or on your own server
  • Processes compliant with KVKK (Turkey's data protection law)

Last reviewed: · Panda Yazılım product team