Morning report automation: from an Excel template to a 07:00 report

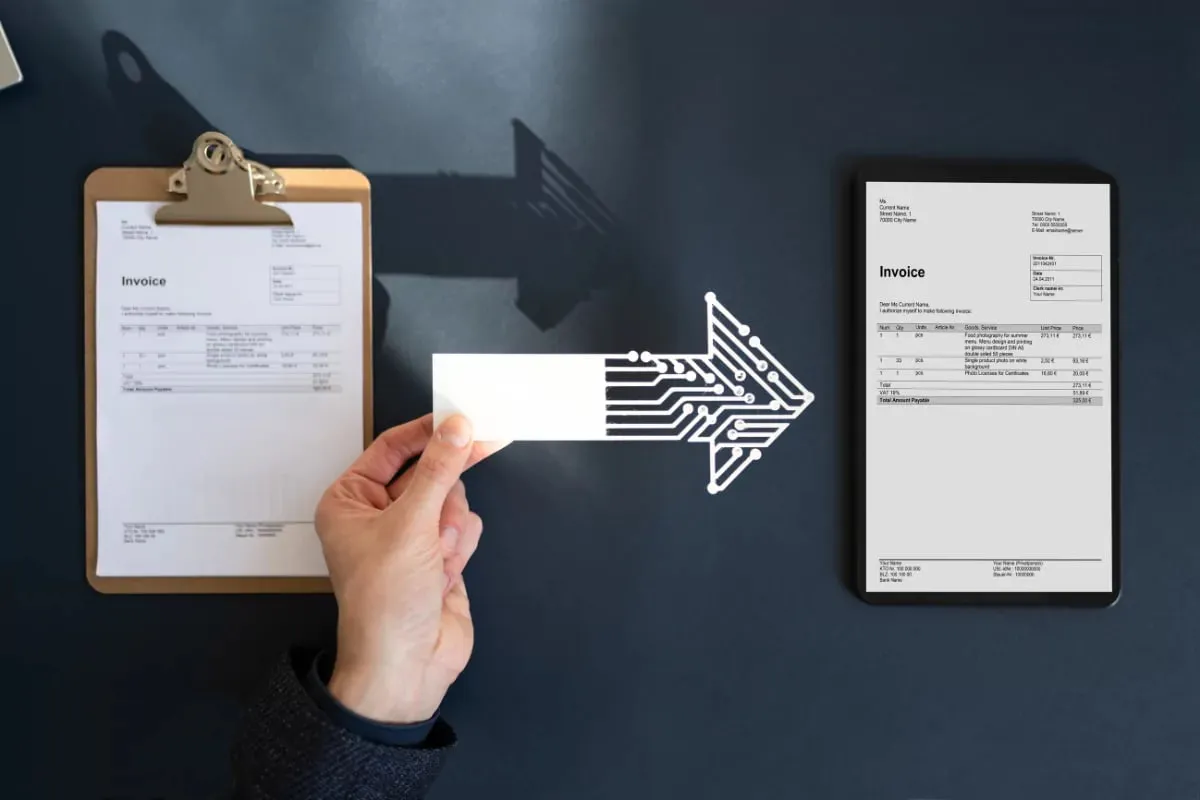
Morning report automation means handing over to an agent the Excel template that is filled in by hand every day. The agent reads the data from the ERP, writes it into the template, flags the rows that exceed the deviation threshold you set, and sends the report at 07:00 by email or WhatsApp. A person reads the report and looks only at the flagged rows.
Why is the morning report a good job for automation?
The morning report is one of the best-suited jobs for automation. Its frequency is daily, its format is fixed, its rule can be written down and it has few exceptions. If someone spends two hours every morning pulling extracts from the ERP, pasting them into Excel, checking totals and sending an email, this job takes about 44 hours a month and about 500 hours a year.
The real loss is not the time but the delay. If the report arrives at 10:00, the manager makes the first decision of the day without it. If the report is on the desk at 07:00, the day's plan is made around the report.

How do you first build the report inventory?
The first step is not to set up something new but to list the existing reports. Which reports are prepared every day, which weekly? Who prepares them, who reads them, how long does it take?
- Report name: morning sales summary, open order list, late collections, critical stock.
- Preparer and readers: who produces the report, who receives it.
- Duration: how many minutes or hours does preparing it take.
- Decision: which decision do you make from looking at the report? A report that does not turn into a decision can be dropped from the list.
One thing often emerges in the inventory: the same data is prepared in three separate reports by three separate people. Merging them before automation makes the job smaller.
Sample report layout
A hand-prepared Excel template is usually multi-sheet. In automation you can keep the same template; the reader sees the layout they are used to. At the top is a five-line summary: yesterday's sales, number of open orders, overdue collections, number of products at critical stock, number of orders to ship today.
Below come the flagged rows and detail sheets. Next to each flagged row the reason is written: "below the last four weeks' average" or "12 days overdue". The report should leave the reader no need to ask a second question.
Where are the data sources read from?
Every report row must have a source. If the sales amount comes from the ERP, collections from the bank statement and stock from the warehouse Excel, there are three sources. The agent can read them all: from the ERP's API or database, from an Excel that arrives by email, from a file in a shared folder.
Note one thing: when reporting, the agent only reads from the ERP and does not change data. A separate user with read permission is enough. The data stays on your server or in your cloud account and does not leave the company.
When each source is updated is also written down. If the bank statement does not arrive by 06:30, yesterday's statement goes into the 07:00 report. The report should state this on the top line: "Collection data is based on yesterday's statement."
How is the deviation threshold set?
Reading a report takes time. A good morning report does not show every row with equal weight; it brings the unusual to the front. For that a threshold is set for each indicator.
- Sales: flagged if yesterday's sales are below the average of the same weekday over the last four weeks by a certain percentage.
- Stock: products that fall below the critical level are listed.
- Collections: customer/supplier accounts that are overdue and above a certain amount are listed.
- Orders: orders whose delivery date is today and which have not shipped are listed.
You set the thresholds. Start wide, narrow them after a week or two. If ten rows are flagged every morning, the threshold is too tight and the reader starts ignoring the flags. If nothing is ever flagged, it is too loose.
A threshold is tied to behaviour more than to a number. The question is: which value makes a person pick up the phone? Ask the manager: by what percentage would sales have to fall for you to call, above what amount does an overdue balance concern you? The answers are the threshold itself. You state the number; the agent applies it.
How is the report delivered: email or WhatsApp?
The channel is set by where the report is read. Two options are common.
- Email: suited to reports needing tables, attachments and detail. The Excel file goes as an attachment, the summary shows in the body.
- WhatsApp: suited to a short summary. Five or six lines of text and, if needed, a link to the detail are enough. The manager takes a quick look on the phone.
In most places both are used together: the full report goes by email, a summary of the flagged rows by WhatsApp. With WhatsApp, only the relevant people's numbers go on the recipient list; it is safer not to send to a phone detail that contains customer or supplier information.
Timing is part of the design too. If the report is to be on the desk at 07:00, the agent should collect the data around 06:30 and allow half an hour of tolerance if a source has not arrived. What to do when the time is up is written down from the start: send with old data and say so, or do not send at all and alert the person responsible.
Weekly and monthly reports are added with the same logic. The weekly summary on Monday morning, the previous month's closing table on the first day of the month. But settle the daily report first; otherwise you have to track four variables at once.
When does a person look?
An automatic report does not switch the person off. It is not only the person who reads the report who looks; a person is involved in three places in the background.
- At setup: the person who knows the business approves the report template and the thresholds.
- In the first weeks: the agent's report is compared side by side with the old hand-prepared report. If the numbers do not match, you find out why.
- When data is missing: if a source has not arrived or a total is unexpectedly zero, the agent does not send the report and asks the person responsible.
The last item matters. Sending a wrong report is worse than sending no report. If the agent is unsure, it waits and writes to a person.
How do you start?
Pick a single report; usually the morning summary that takes the most time. Gather your current Excel template and a week of past files. Panda's report automation scenario describes this flow; a demonstration is given within 3 business days with your own template, and the 30-day pilot starts with a single report.
The measure of the pilot is simple: how many minutes did the person preparing the report spend before, how many now? At what time does the report reach the desk? How many of the flagged rows actually led to an action? These three answers tell you whether to continue.
Your ERP does not change, data does not leave the company, the team does not shrink; its work changes. The person who prepared the report becomes the person who reads it and investigates the causes of deviations.